This strategic initiative aimed to define the north star for SimplePractice's analytics offering
Note: Certain details in this case study were abstracted to protect SimplePractice's interests
Company
SimplePractice
YEAR
2023-24
DURATION
3 months (discovery & concept)
ROLE
Product strategy
Product design
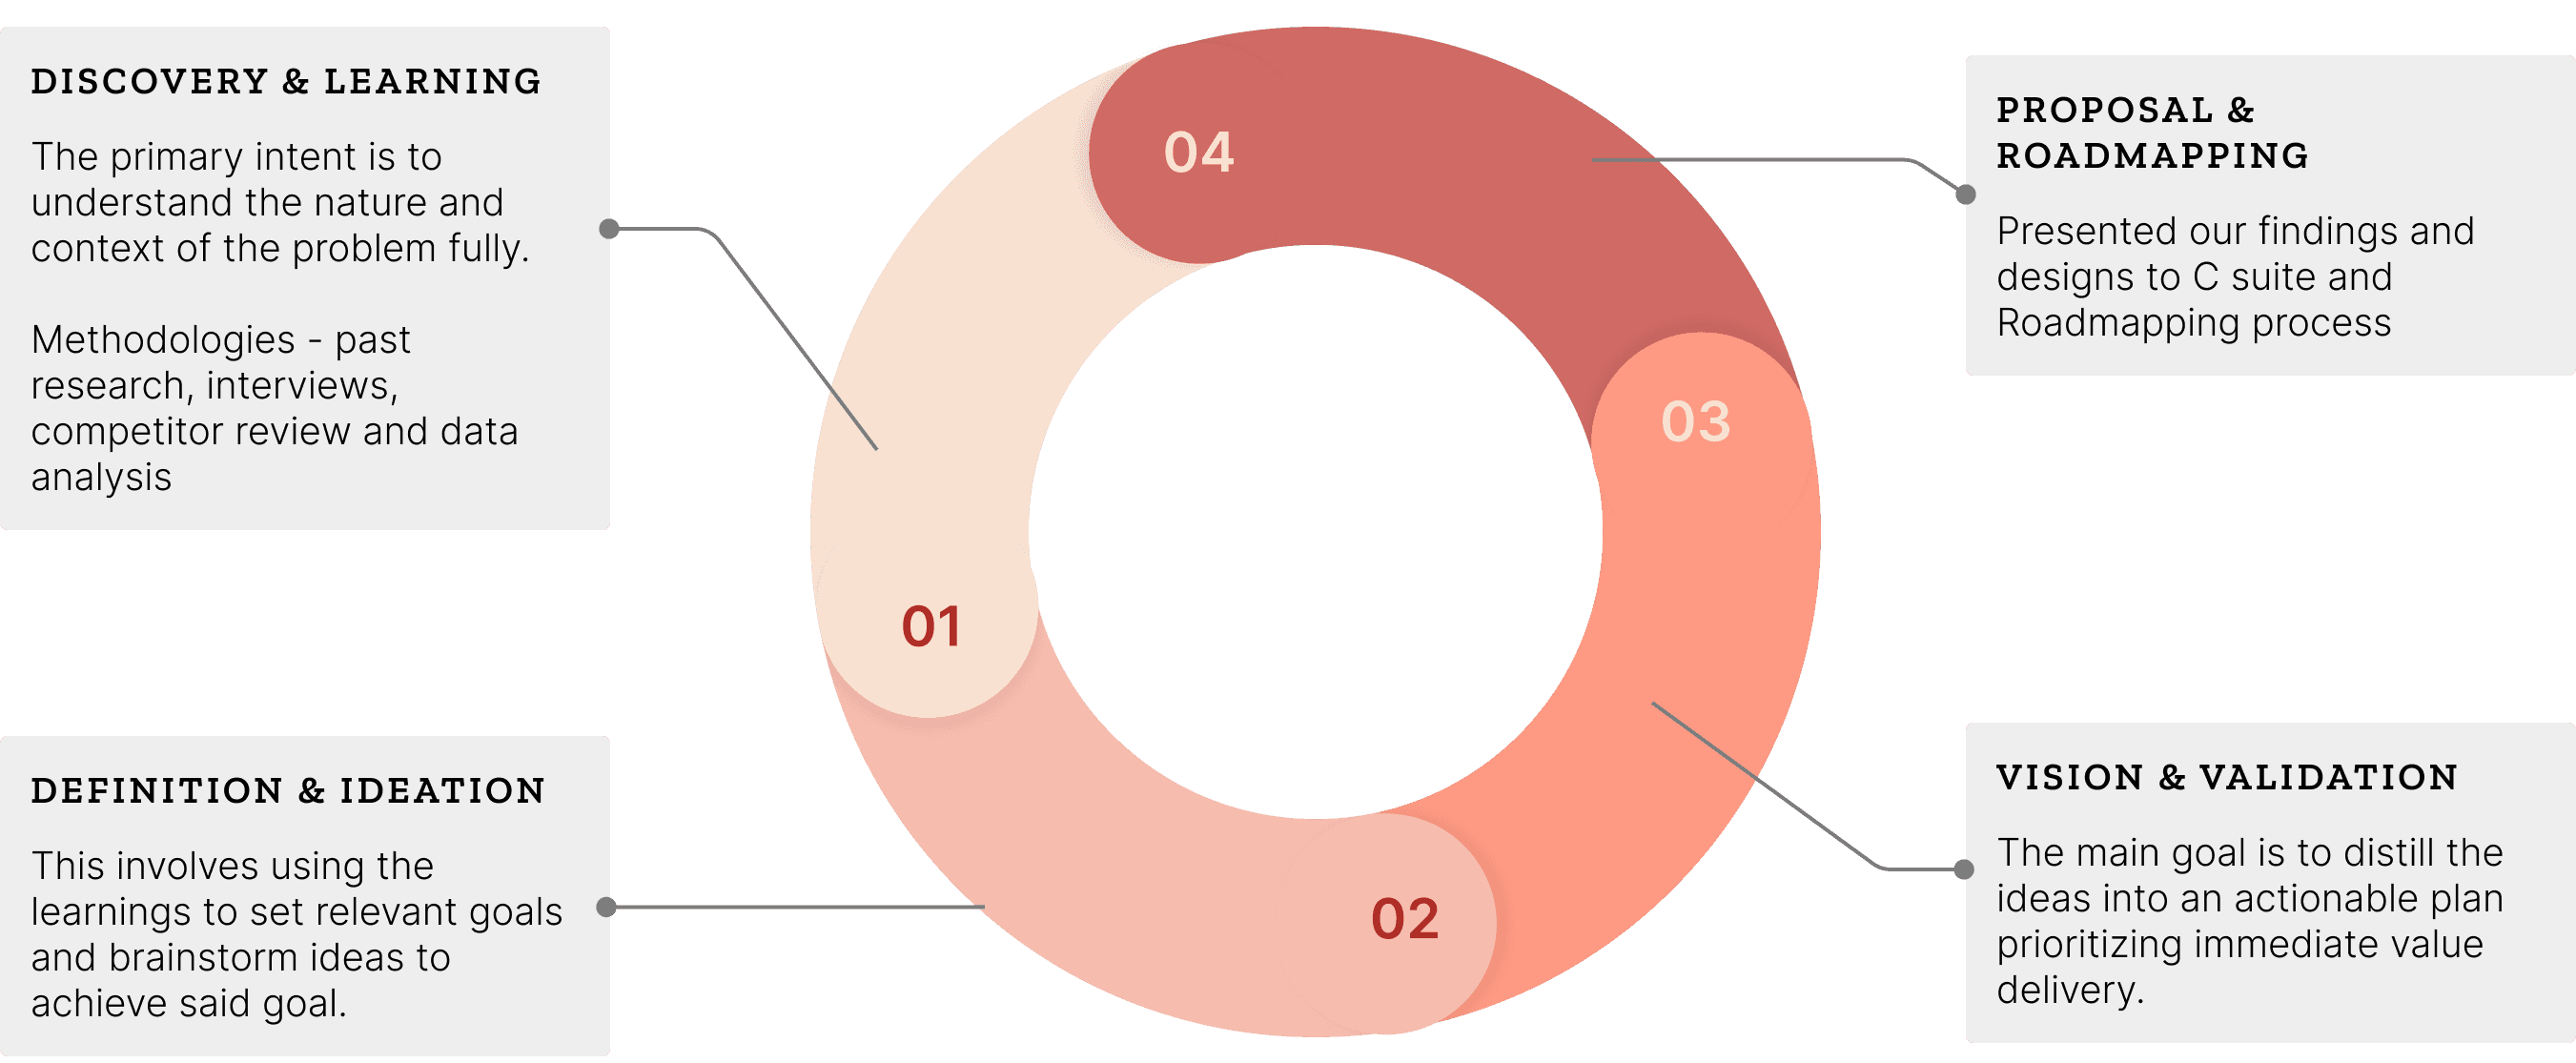
Discovery
As practices grew, so did their data needs
A key business value for SimplePractice is reducing administrative burden, enabling clinicians to focus on clients. Additionally, the business aimed to increase relevance for group practices.
Current analytics were tedious with low adoption
Despite growing data needs, the feature saw limited use, mainly around a few key practice management reports.
Users relied on third-party tools for usable data
Initial feedback showed users often employed external tools and personal spreadsheets to interpret SimplePractice data.
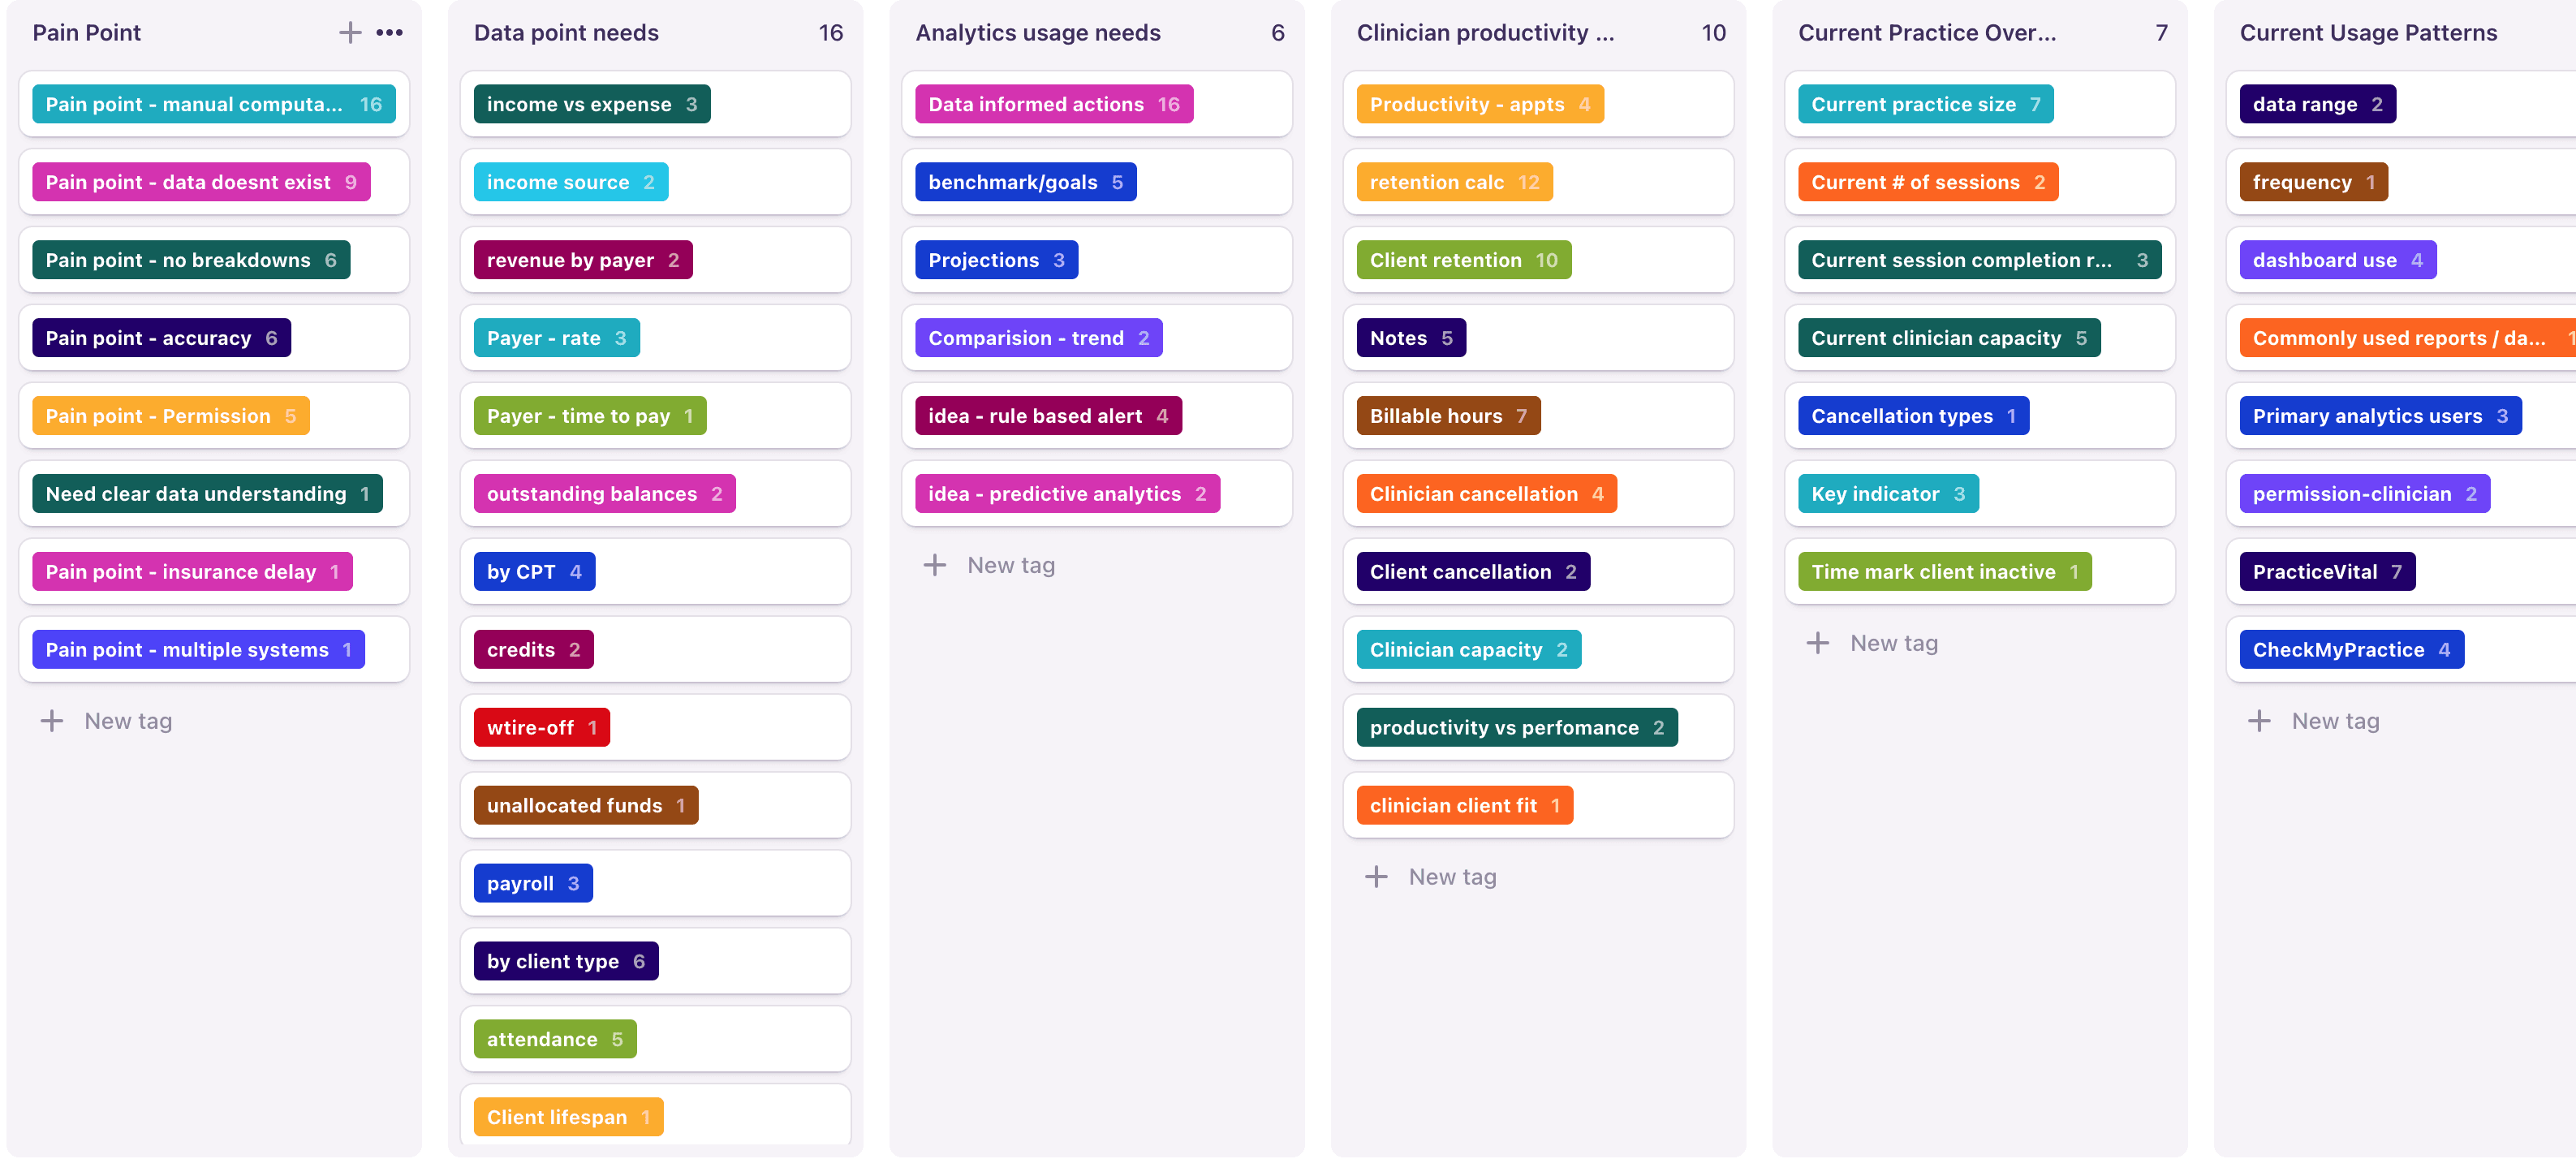
User research indicated our analytics offering felt overwhelming and untrustworthy
“We are 'people' people, not 'numbers' people”
Users felt the analytics were designed for experts. The focus on complex reports and lack of clear explanations made it feel overly complicated. Even larger practices noted clinicians didn't use it, with managers creating their own spreadsheets.
Users distrusted what they didn't understand
Different calculation methods across practices, combined with a lack of clarity in our reports, led to discrepancies and eroded trust in the data.
Users wanted custom reports
Many users expressed the need for custom reporting, citing the tedious process of downloading multiple reports and manually combining data in spreadsheets.
“Tell me what I need to know easily”
Users desired a unified visual highlighting key tasks for quick and clear insights.

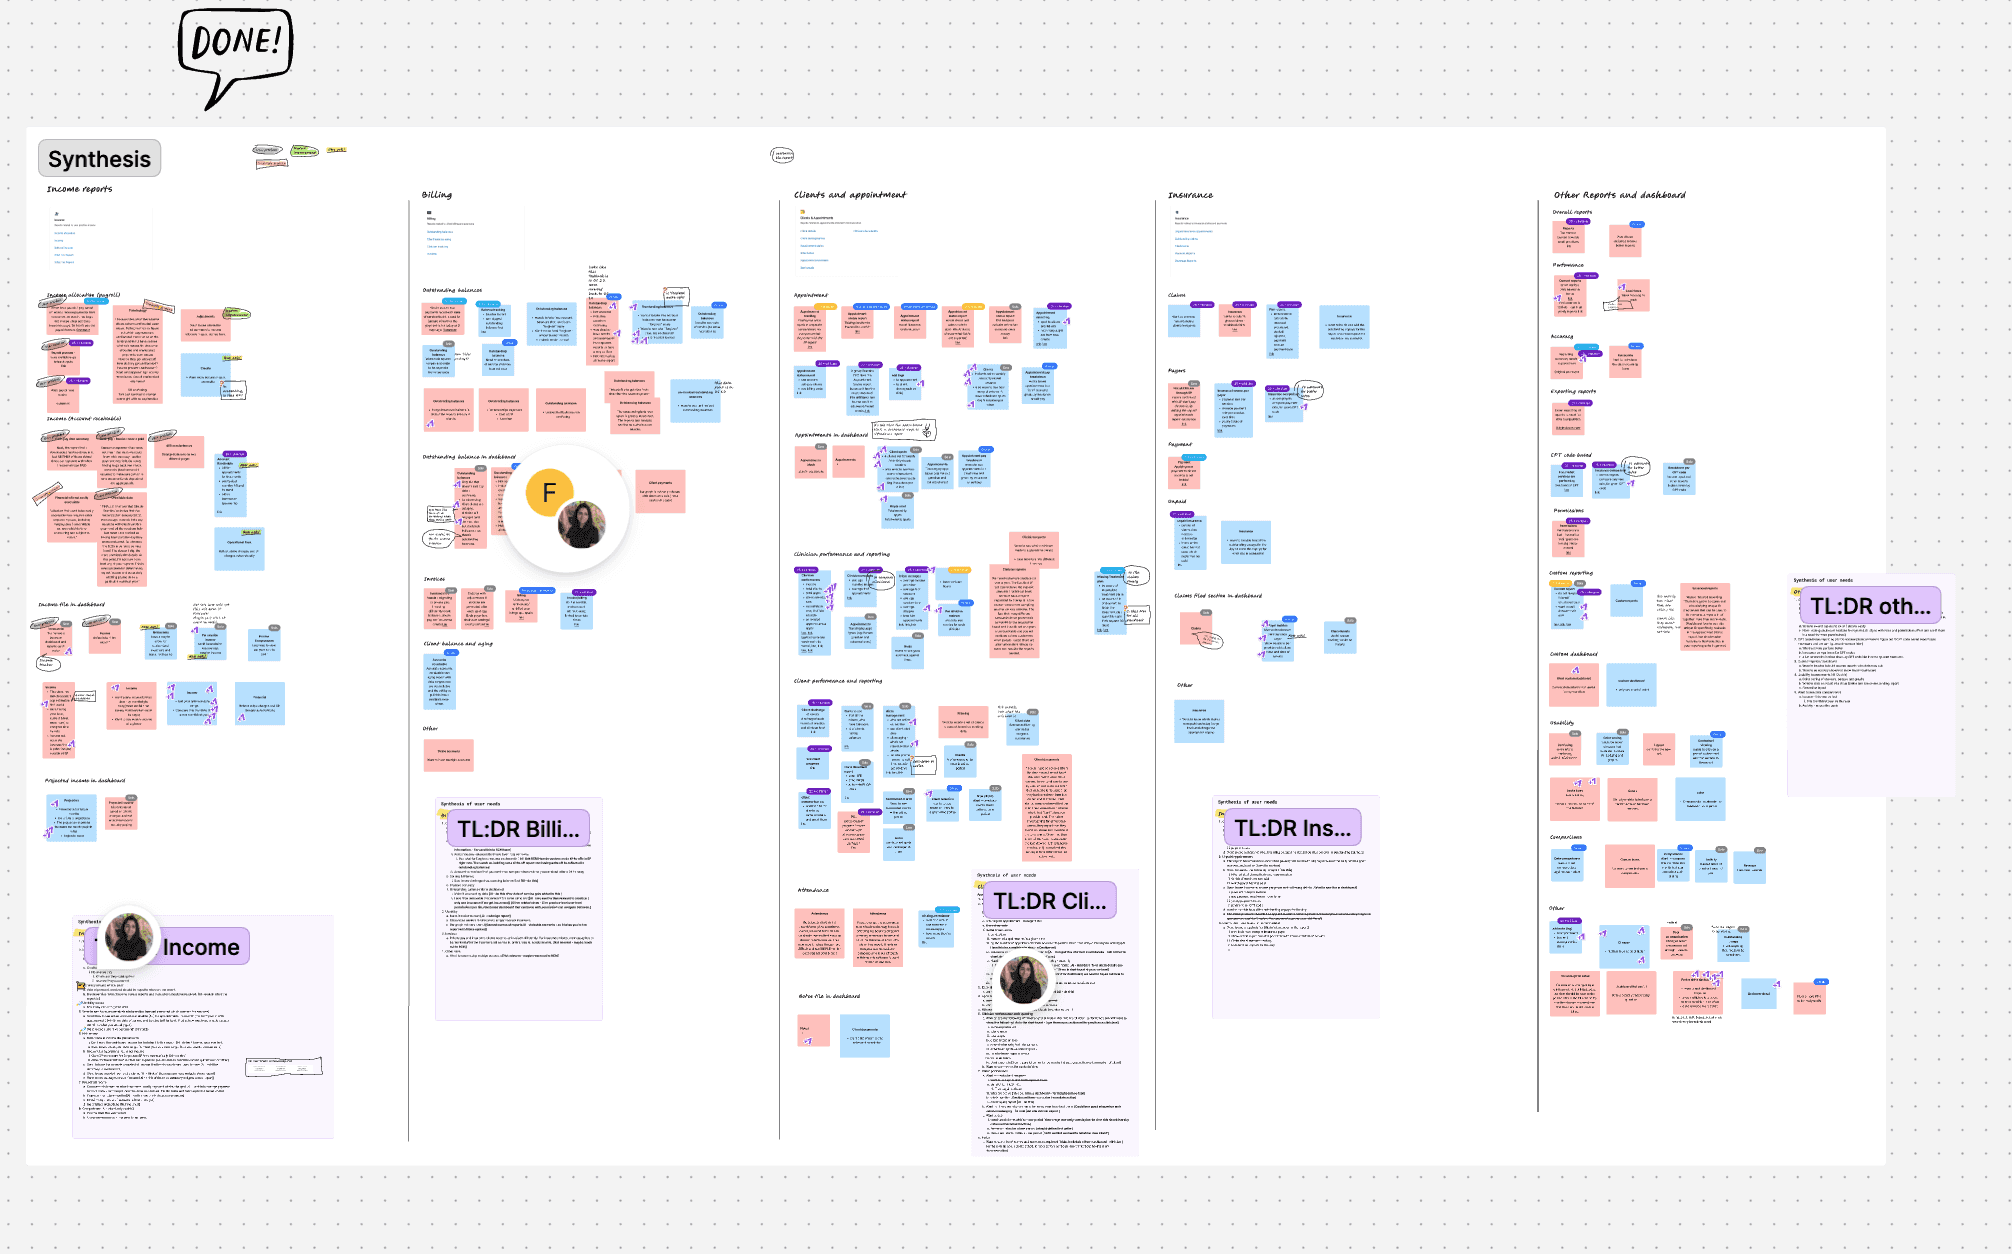
How can I design analytics for non-technical users?
It became apparent that analytics needed a visual solution to provide a picture of practice health.
Make data visual
Users were reluctant to sift through data for the big picture. A visual representation was necessary to reduce cognitive load. A consistent data tile pattern was created to make dashboards easily skimmable.
Optimize for clarity
Numbers are essential, but lack context, especially for new practice owners. Color-coded insights were added to provide context.
Add more relevant data points
Users felt there was insufficient data and lacked direction. More relevant data points were added to each tile. Action items were included to highlight key tasks.
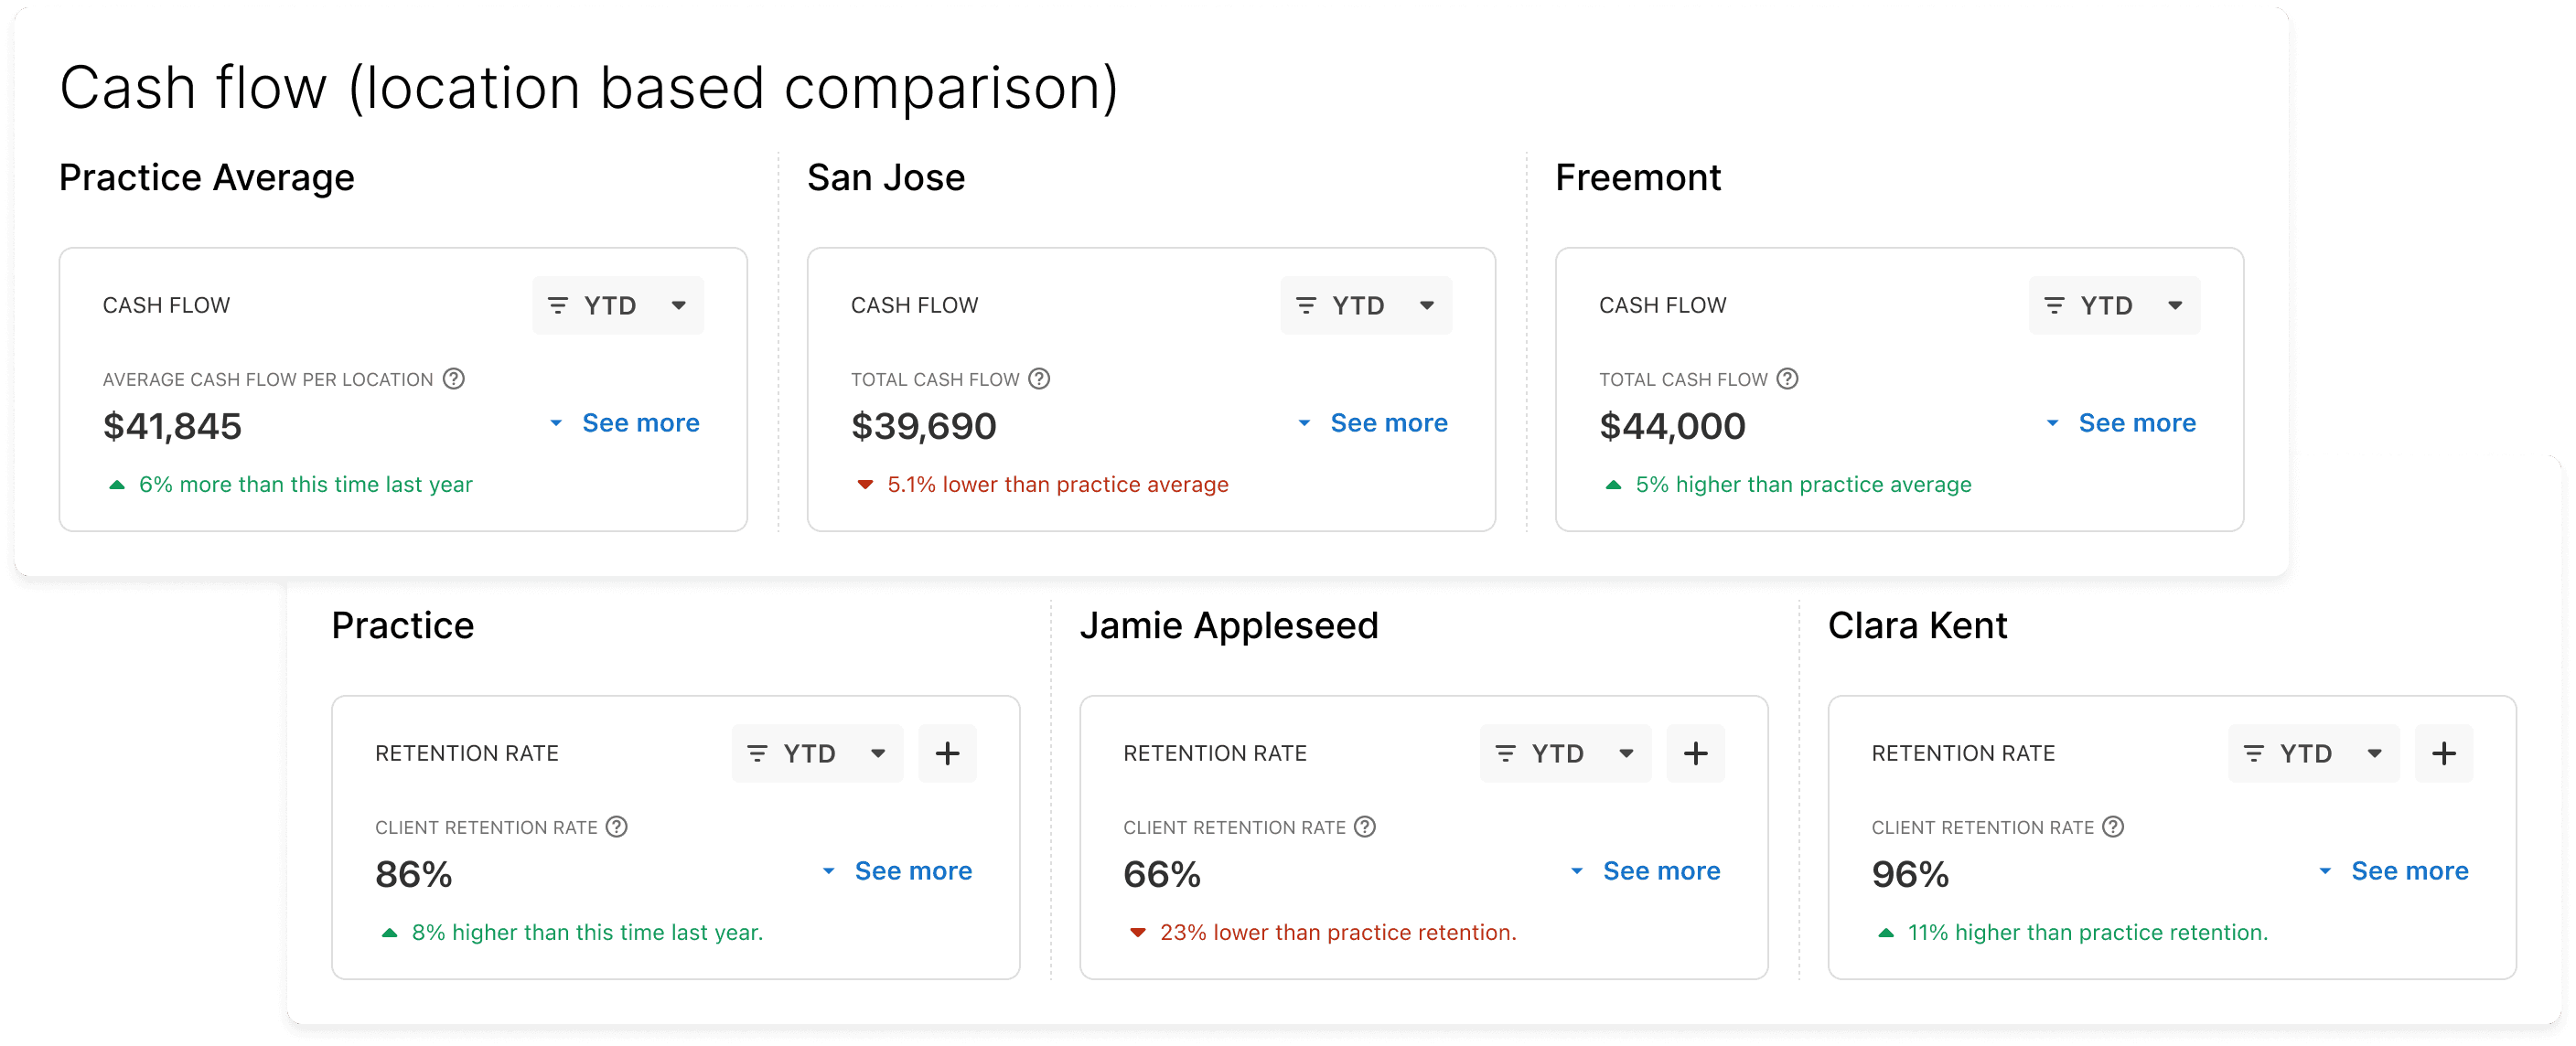
Data manipulation for non-technical users
Practices analyze data differently. Tile-level filters, clickable visualizations, and goal-setting features were added. Performance comparisons across locations and clinicians were also included.


This comprehensive design vision forged a strategic 3 year roadmap for SimplePractice.
Let’s work together
Think I’d be a great fit for your team?